




Started By
Message

 0
0


Posted on 7/13/26 at 8:55 pm to MilkJug
The best non UF teams I have seen in my lifetime(to remove the obvious bias towards UF). In order.
2001 Miami
1995 Nebraska
2019 LSU
2005 Texas
2020 Alabama
Though a tourney of the teams on the original list would be insanely fun to watch at their prime. Someone do a computer simulation so we can watch them. We will all pay you 100 bucks each on therant. Also...open a paypal acct if you do not have one.
2001 Miami
1995 Nebraska
2019 LSU
2005 Texas
2020 Alabama
Though a tourney of the teams on the original list would be insanely fun to watch at their prime. Someone do a computer simulation so we can watch them. We will all pay you 100 bucks each on therant. Also...open a paypal acct if you do not have one.

Posted on 7/14/26 at 3:21 am to Gatorbait2008
That simulation would be based on the same data my model is based on. People wouldn't accept the outcome, because they don't understand how it works. A team's entire body of work matters.
I go back to the 2021 Alabama example (which that retard never responded to). 2021 Alabama beat Georgia 41-24 in the SEC champ game (17-point win for Bama). Yet, in the NC game, Vegas favored Georgia by 2.5. My model favored Georgia by 4. Georgia won by 15. How many Bama fans do you think favored Bama in that game?
This is why ESPN FPI has 2019 OSU and Clemson over LSU. Would 2019 LSU beat Clemson again and OSU, I think so - but my opinion doesn't matter. The body of work matters, and OSU had a more impressive body of work (they essentially had a much better defense than LSU).
My model and Vegas had the winner of the 2021 NC game correct. We consider the entire body of work to determine who we think is better. Why? Because the models determine that is what's most accurate. Tho these models (my model, SP+, Sagarin, ESPN FPI) are the most accurate and are as accurate as they can be, they still aren't that accurate - the dataset is far too limited and there is too much noise and variation in outcomes - due to things like turnovers and many other unpredictable factors. If any of you think you can create a more accurate model than what Vegas puts out, then do it, you'll be mega rich.
What the retards here don't understand is these models are based on math, algorithms, and the data - not opinions or MuH fEeLiNgS (like most people in here). There are zero opinions factored into the models. When you insert an opinion, you insert bias. When you insert bias, it gets exploited by the model, because the model cares about what achieves the most accurate outcome and your opinions/feelings aren't accurate. For example, when I was building this I tried injecting a variation of different increased weights to head-to-head results - e.g. "make head-to-head results 1.25x more important", and every value I tried made the model less accurate at predicting outcomes. Why? because games like 2021 Alabama vs Georgia - and it happens all the time.
Here's a stat for all the idiots in here who think they they have this figured out -
Since 1980
Total in-season rematches : 108
Split outcomes (each team won a game): 49
So, virtually, half of rematches in college football go the other way. And it happens almost every year. Since 2020, there have been 36 in-season rematches. 20 of those went the other way:
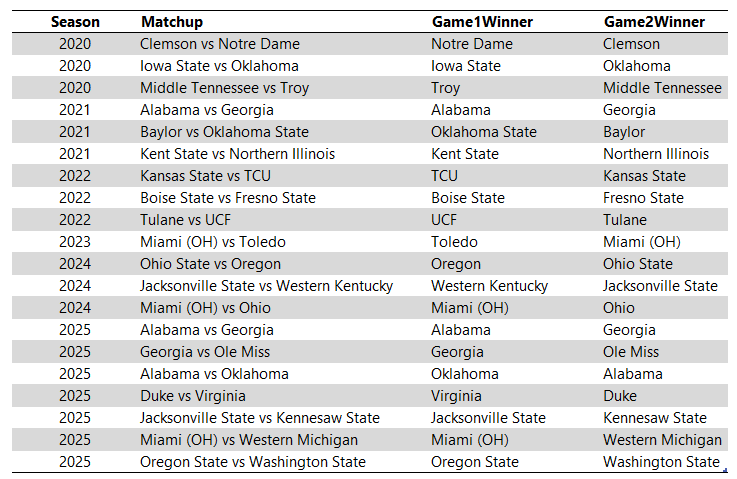
It happened to Bama twice last year!
I go back to the 2021 Alabama example (which that retard never responded to). 2021 Alabama beat Georgia 41-24 in the SEC champ game (17-point win for Bama). Yet, in the NC game, Vegas favored Georgia by 2.5. My model favored Georgia by 4. Georgia won by 15. How many Bama fans do you think favored Bama in that game?
This is why ESPN FPI has 2019 OSU and Clemson over LSU. Would 2019 LSU beat Clemson again and OSU, I think so - but my opinion doesn't matter. The body of work matters, and OSU had a more impressive body of work (they essentially had a much better defense than LSU).
My model and Vegas had the winner of the 2021 NC game correct. We consider the entire body of work to determine who we think is better. Why? Because the models determine that is what's most accurate. Tho these models (my model, SP+, Sagarin, ESPN FPI) are the most accurate and are as accurate as they can be, they still aren't that accurate - the dataset is far too limited and there is too much noise and variation in outcomes - due to things like turnovers and many other unpredictable factors. If any of you think you can create a more accurate model than what Vegas puts out, then do it, you'll be mega rich.
What the retards here don't understand is these models are based on math, algorithms, and the data - not opinions or MuH fEeLiNgS (like most people in here). There are zero opinions factored into the models. When you insert an opinion, you insert bias. When you insert bias, it gets exploited by the model, because the model cares about what achieves the most accurate outcome and your opinions/feelings aren't accurate. For example, when I was building this I tried injecting a variation of different increased weights to head-to-head results - e.g. "make head-to-head results 1.25x more important", and every value I tried made the model less accurate at predicting outcomes. Why? because games like 2021 Alabama vs Georgia - and it happens all the time.
Here's a stat for all the idiots in here who think they they have this figured out -
Since 1980
Total in-season rematches : 108
Split outcomes (each team won a game): 49
So, virtually, half of rematches in college football go the other way. And it happens almost every year. Since 2020, there have been 36 in-season rematches. 20 of those went the other way:
It happened to Bama twice last year!
This post was edited on 7/14/26 at 3:29 am
Posted on 7/14/26 at 4:37 am to MilkJug
With your amazing data you should just beat Vegas every week. You should bets the farm with your proprietary data.
Posted on 7/14/26 at 5:30 am to Hoosyadaddy
When did I say I have "amazing" data? My model isn't quite as good as Vegas. Vegas has an MAE of 12.5 (at its best). Mine is around 12.7 at its best. Some weeks I beat Vegas, some weeks Vegas beats me. I don't have "different" data than SP+, Sagarin, or ESPN FPI. They're all the same types of models, just slightly different variations.
SP+, ESPN FPI, and my model all have OSU over LSU after the 2019 season.
I don't understand why you people are so butthurt about this. It's just for fun to see what result ML comes to based on the available data.
SP+, ESPN FPI, and my model all have OSU over LSU after the 2019 season.
I don't understand why you people are so butthurt about this. It's just for fun to see what result ML comes to based on the available data.

Posted on 7/14/26 at 5:45 am to TigerScorpion
quote:
Could you just not post anymore? That would be better.

Posted on 7/14/26 at 6:05 am to MilkJug
quote:
My model isn't quite as good as Vegas. Vegas has an MAE of 12.5 (at its best).
You think? Your model is retarded lol. LSU was a 5 and a half point favorite in 2019 against Vegas btw. And then smoked them.
Posted on 7/14/26 at 6:08 am to MilkJug
Not butt hurt. Just poking at bit. If nothing else you have generated a lot of conversation. Cheers
Posted on 7/14/26 at 6:18 am to vidtiger23
quote:
You think? Your model is retarded lol. LSU was a 5 and a half point favorite in 2019 against Vegas btw. And then smoked them.
Sometimes Vegas beats me, sometimes I beat Vegas. I already said this. Show us your model, genius?

Posted on 7/14/26 at 7:14 am to MilkJug
2005 USC on the list
2004 USC not on the list
Strange.
2004 USC not on the list
Strange.

Posted on 7/14/26 at 7:27 am to BigBro
'04 USC suffered from their schedule. Barely beating teams like Stanford, Oregon St, and UCLA. All bad teams that year. '05 had a better strength of record. But yall must understand, these are marginal differences, '04 USC is not far behind '05, only 3 points.
Any matchup in this top 25, the model has being a close game within ~7ish points - meaning realistically could go either way.
Any matchup in this top 25, the model has being a close game within ~7ish points - meaning realistically could go either way.
Posted on 7/14/26 at 9:06 am to MilkJug
Do we send our 2019 NC trophy to Ohio or Clemson? Maybe Clemson and then Clemson can send it to Ohio?
Posted on 7/14/26 at 9:34 am to MilkJug
I’d probably lose all hope on life if I spent regular time on whatever bootleg shitty website this came from.

Posted on 7/14/26 at 9:45 am to MilkJug
quote:
Why are you so sure Houston being at #25 is so wrong? They had one of the best offenses we've ever seen. You can say "but they didn't play anyone", well.. prove it
Lets look at their schedule and those teams defensive rankings in PPG.
UNLV 4-7 #88
ASU 6-4 #53
Temple 1-10 #102
Baylor 5-6 #19
AM 8-4 #16
SMU 2-9 #106-dead last
Arkansas 10-2 #30
TCU 4-7 #74
Texas 5-6 #70
TT 9-3 #51
Rice 2-8 #81
Combined 56-66 with an average of 63. Their overall strength of schedule was 63. The best team they played was Texas Am who held their passing attack to almost 200 yards below their average and only gave up 1 touchdown. They played 4 teams with a winning record and lost two of them. How is that a top 25 team since 1960?
Posted on 7/14/26 at 10:29 am to Porter Osborne Jr
'89 Houston had one of the most potent offenses in the history of the sport - arguably the most potent. Their defense was average. Model has them at 25.
The model has '08 Oklahoma higher than Houston. Oklahoma had less pts/game and a slightly worse defense that Houston - but Oklahoma played a tougher schedule. All of that is factored in.
I think you need to go look at the points those two teams put up.
The model has '08 Oklahoma higher than Houston. Oklahoma had less pts/game and a slightly worse defense that Houston - but Oklahoma played a tougher schedule. All of that is factored in.
I think you need to go look at the points those two teams put up.


Posted on 7/14/26 at 10:40 am to MilkJug
Well, I signed up. Good luck with the site.
Posted on 7/14/26 at 12:32 pm to MilkJug
A potent offense that played a ton of shitty defenses. 2013 Baylor had tougher schedule but I don’t seem them on there despite only averaging 1 point less per game. Houston also ran the score up on terrible defenses. Who cares if they were dickheads and rung 95 up on a terrible SMU team. They are getting too much credit for running the scores up on the sisters of the week.

Posted on 7/14/26 at 12:47 pm to MilkJug
quote:Not even close to being accurate. The big offensive numbers that the 1989 Houston team put up were in large part due to a combination of weak opponents and a coaching staff that was notorious for running up the score. Case in point, the SMU team that Houston beat 95-21 was playing its first season after being hit with a two-year "death penalty" by the NCAA, and wasn't much more than a glorified high school team. There's a reason Houston was ranked 14th at the end of that season.
'89 Houston had one of the most potent offenses in the history of the sport - arguably the most potent.
This post was edited on 7/14/26 at 12:52 pm


Posted on 7/14/26 at 1:19 pm to Porter Osborne Jr
quote:
They are getting too much credit for running the scores up on the sisters of the week.
Another good point - is there any mechanism for discounting running up the score?
Does beating Vandy 56-0 rate lower than beating them 66-3?
Posted on 7/14/26 at 1:32 pm to MilkJug
Well, realistically speaking, due to the improvement in CFB teams over time, the worst team in the Power 4 today would probably beat 2001 Miami and 1995 Nebraska. And if you go back to the 1970s, well, those best teams from the 1970s would lose to the worst team in the Group of 5 today.
I know these ratings are adjusted for the team's ranking relative to the season when they played. But it's something to keep in mind when looking at these ratings.
I know these ratings are adjusted for the team's ranking relative to the season when they played. But it's something to keep in mind when looking at these ratings.
This post was edited on 7/14/26 at 1:37 pm

 Page 3 of 6

Popular
Back to top
 Follow SECRant for SEC Football News