Started By
Message
re: Updated Net Rankings
Posted on 1/26/21 at 10:07 am to skrayper
Posted on 1/26/21 at 10:07 am to skrayper
quote:
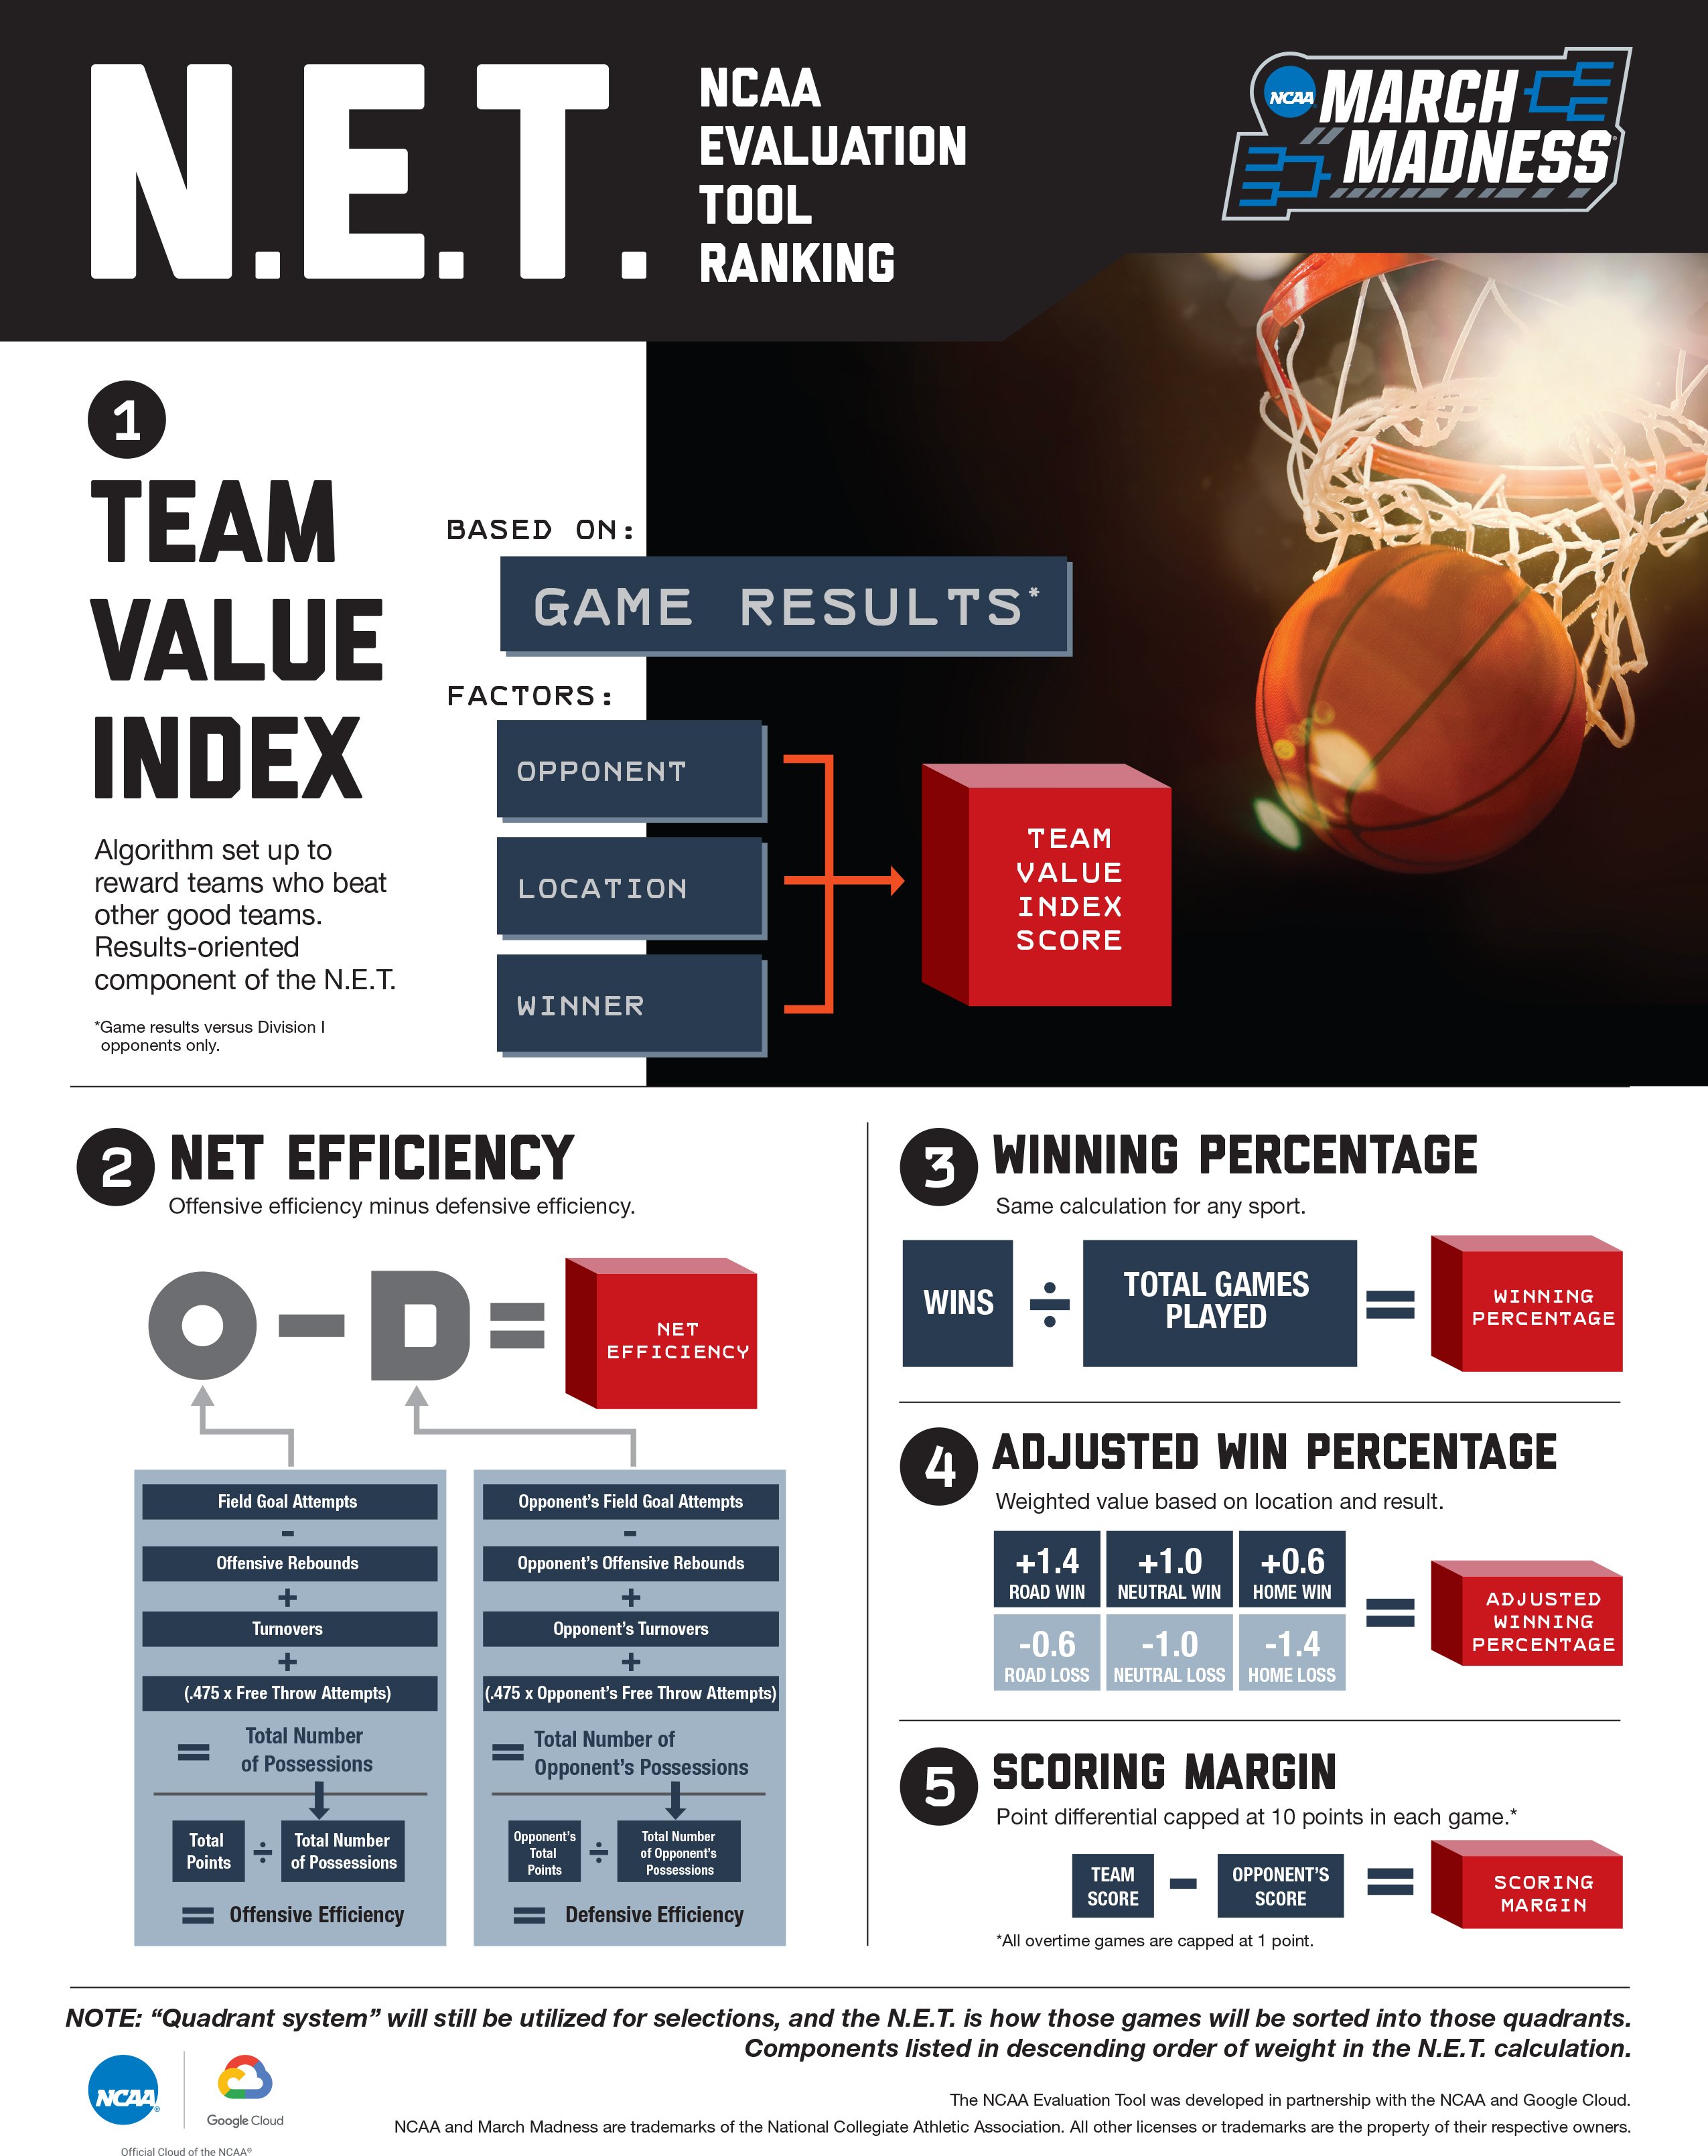
Does margin of loss play a factor?
It does, but only >10 points. So that is possibly one factor as both their losses were by +10 (one was a Q2 loss by 10+) and they've had 2 wins against Q3 of less than 10
- Liberty by 9 (Q3)
- Bradley by 1 (Q3)
So, that probably is why. I'd guess all the teams between #15-25 are very close and that probably weighed Mizzou down.
 2
2

Posted on 1/26/21 at 10:12 am to skrayper
quote:
Does margin of loss play a factor?
Not sure NET uses margin of victory, per se. However, I think they do use efficiency stats more heavily than RPI.
I suppose that's the only explanation but, still, winning that many NET Q1 games would seem impossible without pretty good efficiency numbers in those games. Really a mystery.
The only real pro-RPI outlier on their resume is the Wichita St away win (28 RPI, 64 NET) but the rest of their wins are mainly the opposite, better NET rankings than RPI.
This post was edited on 1/26/21 at 10:16 am
Posted on 1/26/21 at 10:23 am to SummerOfGeorge
quote:
It does, but only >10 points

Posted on 1/26/21 at 10:23 am to rockiee
11 points or 41 pts all the same rock!

Posted on 1/26/21 at 10:25 am to SummerOfGeorge
Sorry but Bama only beat us by 10, OVERRATED *CLAP* *CLAP* *CLAP*.......
Posted on 1/26/21 at 10:26 am to rockiee
quote:
Sorry but Bama only beat us by 10, OVERRATED *CLAP* *CLAP* *CLAP*.......

Posted on 1/26/21 at 10:29 am to SummerOfGeorge
We have been on the better side of that arrangement but most of our games have been greater than 10 points either way, except for Auburn last week and at Tennessee.
Posted on 1/26/21 at 10:30 am to rockiee
Listen, I liked it better when there was no math involved
Posted on 1/26/21 at 10:35 am to SummerOfGeorge
This graphic was always cool to make everything not so confusing
Posted on 1/26/21 at 11:37 am to JesusQuintana
I guess good thing mizzou mob didn't get cuonzo fired earlier this year like they were calling for
This post was edited on 1/26/21 at 11:38 am
Posted on 1/26/21 at 2:35 pm to SummerOfGeorge
quote:
It does, but only >10 points. So that is possibly one factor as both their losses were by +10 (one was a Q2 loss by 10+) and they've had 2 wins against Q3 of less than 10
- Liberty by 9 (Q3)
- Bradley by 1 (Q3)
So, that probably is why. I'd guess all the teams between #15-25 are very close and that probably weighed Mizzou down.
Margin of victory isn't really capped due to "net efficiency". The reason Missouri is so low on these rankings is because their net efficiency isn't that great despite a good looking resume on the surface. Missouri hasn't had blowouts that pad efficiency stats like Alabama has had recently. Before the Kentucky game Alabama's net efficiency was a smidge higher than Missouri's. In the last four games, Alabama has nearly doubled its net efficiency and consequently shot up in the rankings.
Posted on 1/26/21 at 2:40 pm to Papplesbeast
Yea - I had forgotten what a large part of the NET is the efficiency numbers. That's definitely the drag for Missouri.
And honestly, I never liked that being part of the calculation. I love KenPom and the efficiency figures for analyzing stuff, but your resume should be what you've done, not how you've played from an efficiency perspective, IMHO.
And honestly, I never liked that being part of the calculation. I love KenPom and the efficiency figures for analyzing stuff, but your resume should be what you've done, not how you've played from an efficiency perspective, IMHO.
Posted on 1/26/21 at 2:49 pm to SummerOfGeorge
The problem I see with net efficiency is that, as far as I can tell, it doesn't have diminishing returns for blowouts. Games are played differently when they become blowouts which limits their predictive utility to a certain extent. I don't know if KenPom has a way to account for this, but it seems like the kind of thing that couldn't be automated. It would probably have to be done manually.
This post was edited on 1/26/21 at 2:51 pm
Posted on 1/26/21 at 2:51 pm to Papplesbeast
quote:
The problem I see with net efficiency is that, as far as I can tell, it doesn't have diminishing returns for blowouts. Games are played differently when they become blowouts which limits their predictive utility to a certain extent. I don't know if KenPom has a way to account for this, but it seems like the kind of thing that would couldn't be automated. It would have to be done manually.
Yea, I've never really looked to see if KenPom has a sort of "garbage time" elimination like a lot of football analytics do. I've never read about it, and from reviewing game scores and numbers I don't see anything that makes it seem like they do.
As you noted, games are played differently in blowouts - both in style and personnel.
This post was edited on 1/26/21 at 2:52 pm
Posted on 1/26/21 at 3:20 pm to SummerOfGeorge
Something else to note in the Net is just the standard win % which is going to be even more unbalanced this year because of all the postponed/canceled games.
Posted on 1/26/21 at 3:25 pm to rockiee
quote:
Something else to note in the Net is just the standard win % which is going to be even more unbalanced this year because of all the postponed/canceled games.
Good point

 Page 2 of 2


Popular
Back to top