Started By
Message

SEC AP Rankings
Posted on 9/3/24 at 3:15 pm
Posted on 9/3/24 at 3:15 pm
Ok, so I took the rankings and added them all up and got a total for OU. For the bottom 3 teams I used 50 so each team has a score.
For OU, our total comes to 141. The lower the number the harder the schedule. Curious what others combined numbers come to, I don’t have time to do all of them.
I did do tx and their number comes to 263. That helps show how much easier their schedule is.
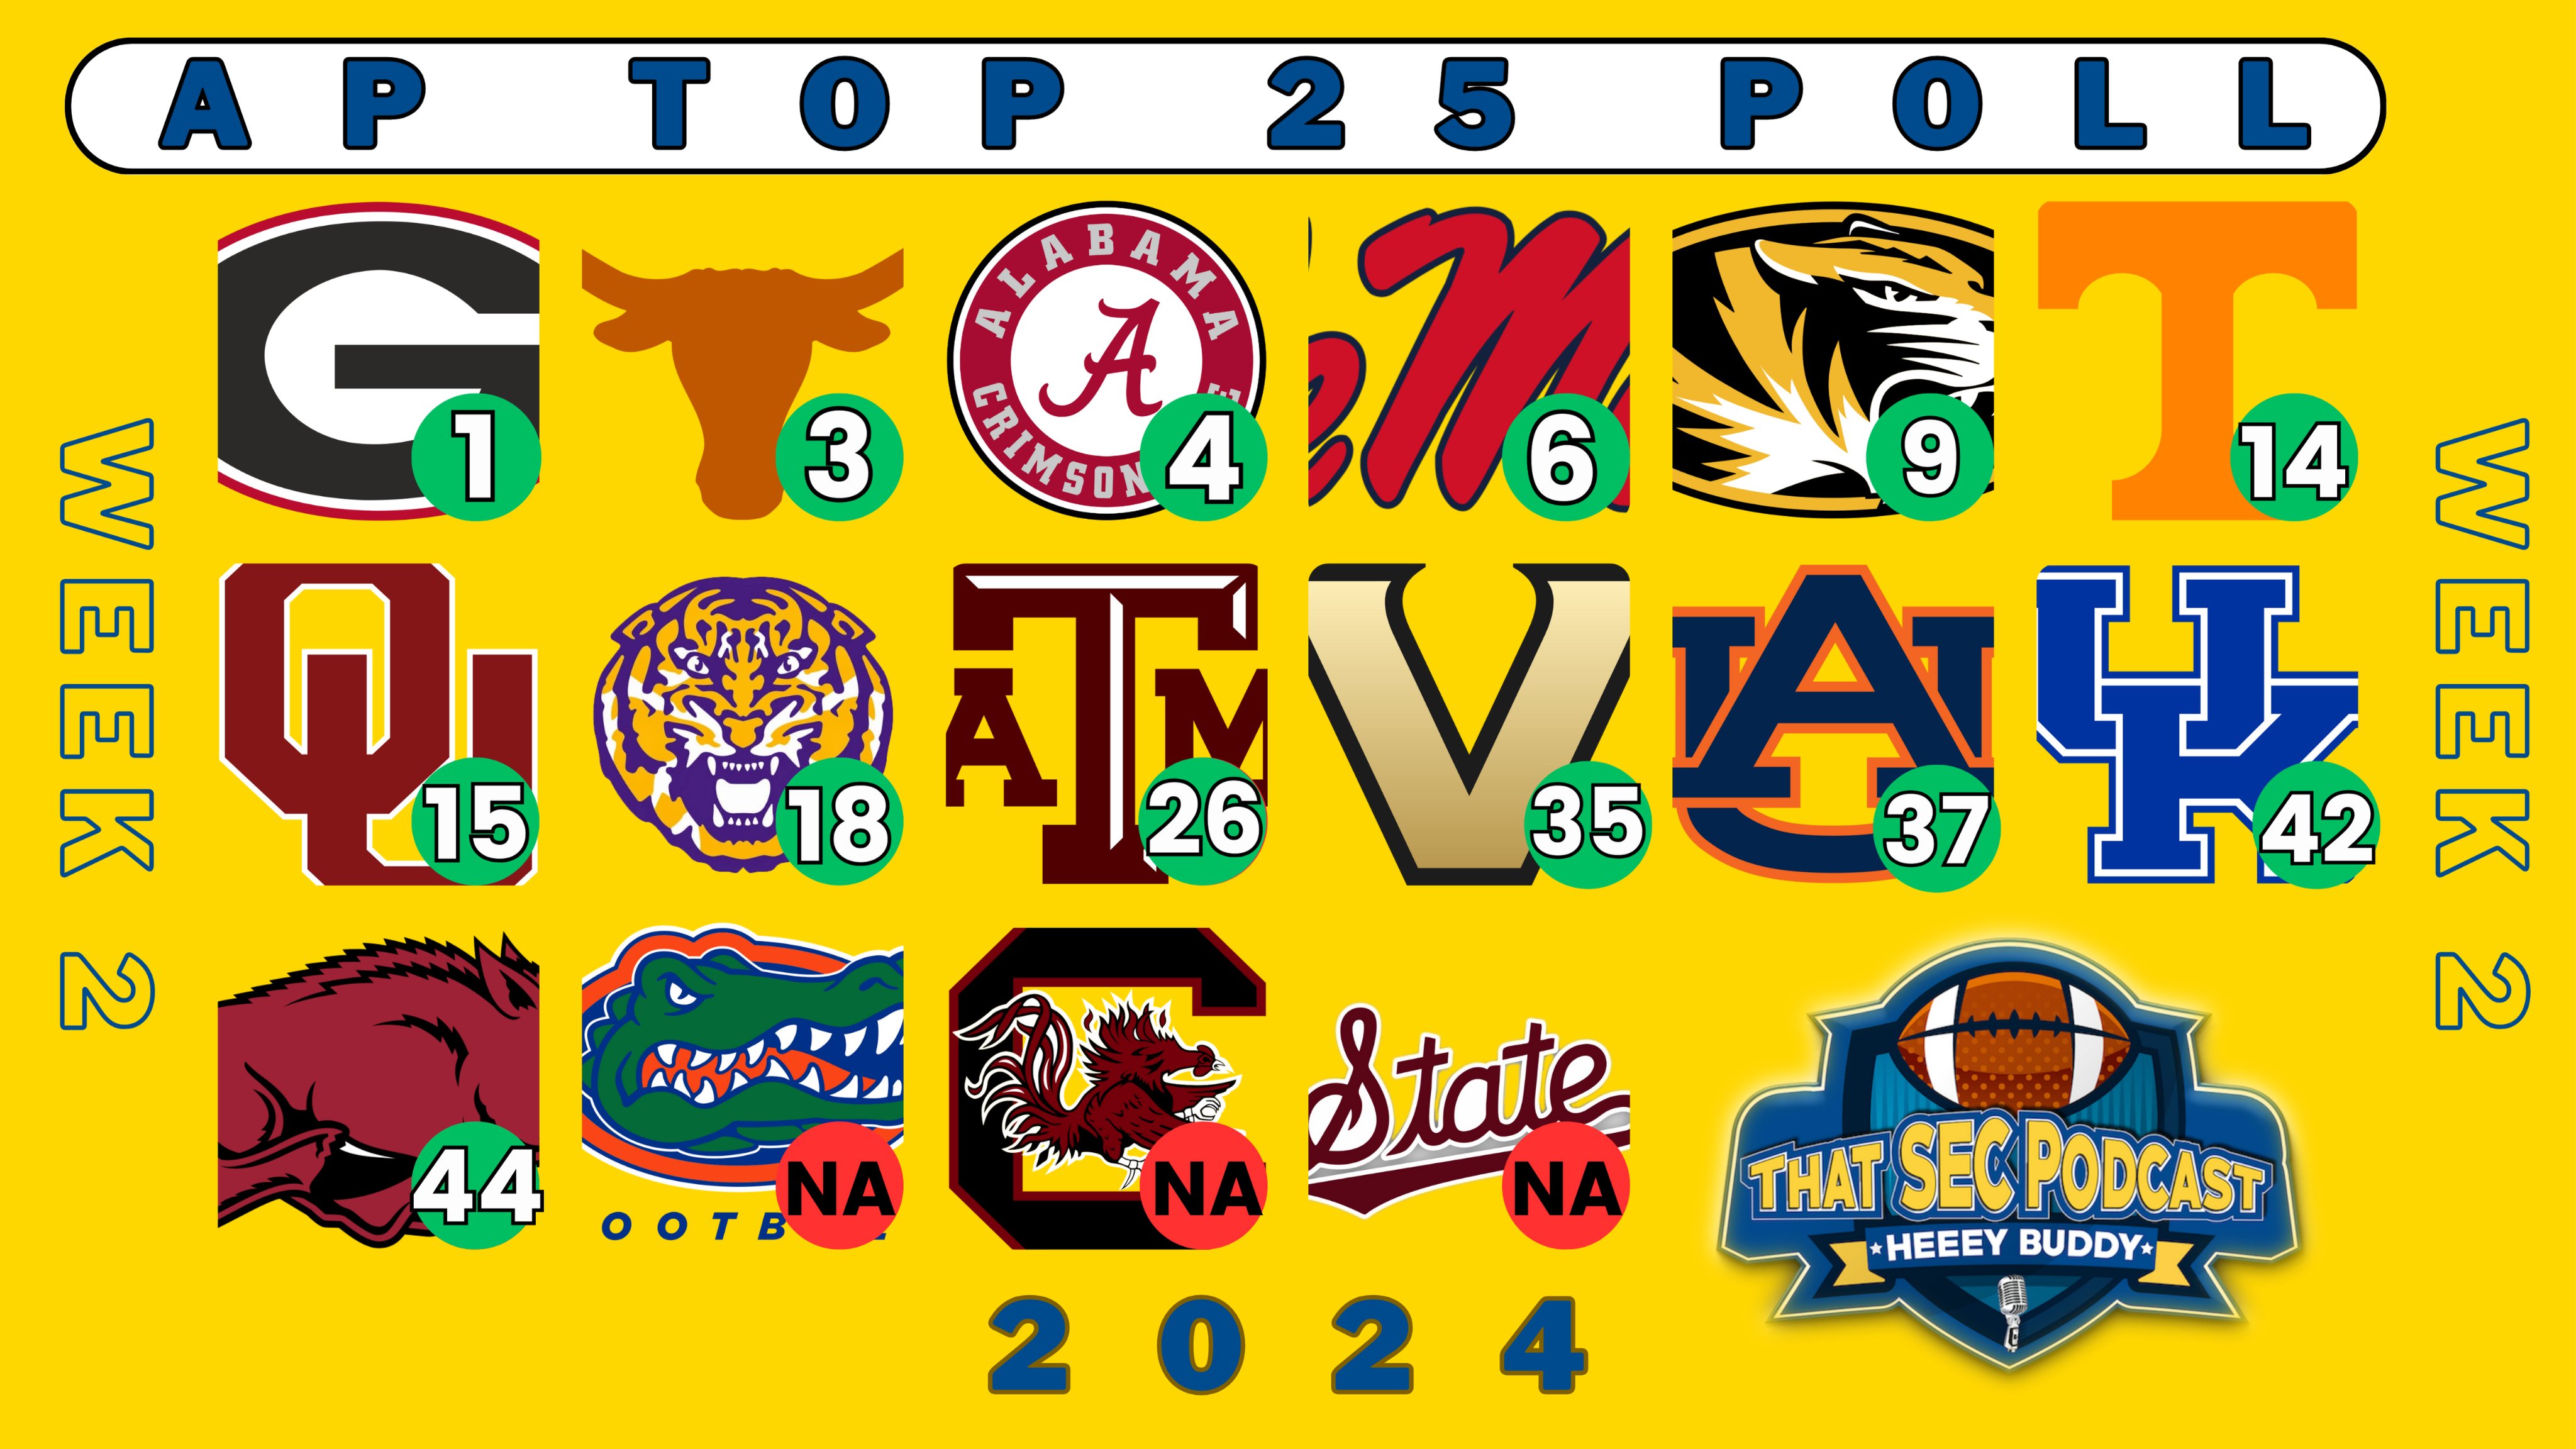
For OU, our total comes to 141. The lower the number the harder the schedule. Curious what others combined numbers come to, I don’t have time to do all of them.
I did do tx and their number comes to 263. That helps show how much easier their schedule is.
 11
11

Posted on 9/3/24 at 3:25 pm to OU Guy
Yeah. Jumping right on it.

Posted on 9/3/24 at 3:32 pm to OU Guy
quote:
Curious what others combined numbers come to, I don’t have time to do all of them.

Posted on 9/3/24 at 3:39 pm to Summer of Jimbo
Add the rankings of the SEC teams you play and get a total. Will show how hard your schedule is compared to others totals.
Easy peazy
Easy peazy

Posted on 9/3/24 at 3:43 pm to OU Guy
quote:
For OU, our total comes to 141. The lower the number the harder the schedule. Curious what others combined numbers come to, I don’t have time to do all of them.
Alabama's comes out to 123.

Posted on 9/3/24 at 3:46 pm to OU Guy

Posted on 9/3/24 at 3:46 pm to OU Guy
206 for us, though it's worth noting we play 4 of the other 5 teams on the top row with 3 of those being on the road.

Posted on 9/3/24 at 3:50 pm to OU Guy
As I have said for a while now..
The main reasons for the discrepancy are simple.
1) Mississippi Schools
Lane Kiffin arrived. Mike Leach died.
They used a 10 year window I believe, and that didn't take into account either of those things. It's a big difference now.
2) Tennessee out of the Toilet
Tennessee's record during the 10 year window was horrible compared to where they are now.
2012 5-7
2013 5-7
2014 7-6
2015 9-4
2016 9-4
2017 4-8
2018 5-7
2019 8-5
2020 3-7
2021 7-6
Total 62-61
Those two things really caused a big discrepancy for some teams. I understand that you don't like it, and I wouldn't either if I were you.. but it is what it is.. there was logic behind their rankings..
As an example, if you switched Ole Miss and Miss State on our schedules, the differential gets close enough where it's reasonable, but Miss State had a better 10 year window.
Posted on 9/3/24 at 3:52 pm to OU Guy
quote:
Will show how hard your schedule is compared to others totals.
Not really. Tell me which schedule is harder.
Vs #24 and #25, or vs #1 and #50.
According to you, playing against #24 and #25 is the more difficult schedule, with a score of 49 vs 51. However, the other schedule is actually MUCH MUCH more difficult. A top10 team is very likely to come out winning both games against #24 and #25 without too much struggle, a top5 team for sure. Yet a top5/10 team is at the same time much more likely to have a loss on the 2nd schedule.
Any SoS based on averages is trash for this reason, which is 99% of all SoS metrics. A good SoS metric will instead take into account the number of expected losses a great team(aka top5/10) could expect on the schedule being played.
Posted on 9/3/24 at 4:00 pm to 3down10
Texas plays 4 of the Top 9 schools
Oklahoma plays 5 of the Top 9 schools
That seems pretty even.
Anchor Down.

Oklahoma plays 5 of the Top 9 schools
That seems pretty even.
Anchor Down.
Posted on 9/3/24 at 4:54 pm to 3down10
quote:
Alabama's comes out to 123.
I got 179
Posted on 9/3/24 at 5:00 pm to 3down10
quote:
Not really. Tell me which schedule is harder.
Vs #24 and #25, or vs #1 and #50.
According to you, playing against #24 and #25 is the more difficult schedule, with a score of 49 vs 51. However, the other schedule is actually MUCH MUCH more difficult. A top10 team is very likely to come out winning both games against #24 and #25 without too much struggle, a top5 team for sure. Yet a top5/10 team is at the same time much more likely to have a loss on the 2nd schedule.
Any SoS based on averages is trash for this reason, which is 99% of all SoS metrics. A good SoS metric will instead take into account the number of expected losses a great team(aka top5/10) could expect on the schedule being played.
Say what? I am using all 8 games not 2 cherry picked ones.
Using AP rankings and adding all 8 opponents will give you an idea of the depth of your schedule. It doesn’t mean its easy by any measure. But a lower number means your overall SEC schedule is harder or easier based on current rankings.
It does not mean the rankings won’t change because they will. And it does not mean the worst team can’t best you because they can on a given day. It just shows overall schedule strength within conference. This will become important for teams fighting for that last SEC playoff spot if 3 or 4 are tied in record.
This post was edited on 9/3/24 at 5:02 pm

Posted on 9/3/24 at 5:04 pm to OU Guy
quote:
Add the rankings of the SEC teams you play and get a total. Will show how hard your schedule is compared to others totals.
Easy peazy
Why? The schedule evolves.
Posted on 9/3/24 at 5:07 pm to BigBro
quote:
As I have said for a while now..
The main reasons for the discrepancy are simple.
1) Mississippi Schools
Lane Kiffin arrived. Mike Leach died.
They used a 10 year window I believe, and that didn't take into account either of those things. It's a big difference now.
2) Tennessee out of the Toilet
Tennessee's record during the 10 year window was horrible compared to where they are now.
2012 5-7
2013 5-7
2014 7-6
2015 9-4
2016 9-4
2017 4-8
2018 5-7
2019 8-5
2020 3-7
2021 7-6
Total 62-61
Those two things really caused a big discrepancy for some teams. I understand that you don't like it, and I wouldn't either if I were you.. but it is what it is.. there was logic behind their rankings..
As an example, if you switched Ole Miss and Miss State on our schedules, the differential gets close enough where it's reasonable, but Miss State had a better 10 year window.
Show me one quote where I said I didn’t like it. Just one will do.
I am only showing strength of schedule thats it. I embrace it. We will have at least 3 losses and yet can still beat 3 ranked SEC teams. The old days are over. No divisions.
We will likely have more quality losses which may matter if there is a logjam for final conference teams picked for playoffs. But we signed ip for this and I love it. Separate from rankings the quality of games and game day experiences will be so much better than anything we had before.
Hope that clears it up, don’t make assumptions or put words in my posts that don’t exist.
Posted on 9/3/24 at 5:09 pm to OU Guy
I did a quick review and OU is looking up at Mizzou in the rankings by a ton.
Posted on 9/3/24 at 5:11 pm to koreandawg
quote:
Why? The schedule evolves.
Thats the fun of it. To see how this changes over the year. Teams will go up and down and that will change this. Will be interesting to see how much.
Its football season and football talk is fun. And seeing how much harder the overall SEC is now by adding 2 more ranked teams. Since OU and tx play every other team that means every SEC team added an extra ranked opponent to schedule.

Posted on 9/3/24 at 5:31 pm to OU Guy
I did Florida’s, it came out to -69.
Posted on 9/3/24 at 5:49 pm to OU Guy
quote:
Say what? I am using all 8 games not 2 cherry picked ones.
It's not about cherry picked games, it's about the basic math and how averages and numbers work.
I was just explaining to you why averages are flawed as a metric(or total points, which is basically the same thing when everyone has the same number of games). You still have the same affect over 10 or even 20 games. You are going to over value middle teams while undervaluing the more difficult teams. It's just a basic function of the math.
I was only demonstrating the flaw, and only using 2 teams makes it easier to see.
Sadly there isn't a great SoS metric anymore. There was until ESPN bought SP+ and put it behind a paywall. Now the metric only uses FEI, which was only half the original formula.
This post was edited on 9/3/24 at 6:38 pm

Posted on 9/3/24 at 6:00 pm to OU Guy
Does anyone understand this formula?
Posted on 9/3/24 at 6:02 pm to trackem
Looking good Vandy

 Page 1 of 2

Popular
Back to top