Started By
Message
How much teams spent for college baseball (Jul 2024-Jun 2025)
Posted on 3/12/26 at 9:59 am
Posted on 3/12/26 at 9:59 am
Matt Brown
@MattBrownEP
in today's Extra Points, we obtained the FY25 operating budget for (nearly) every public school college baseball program
here's who spent a lot of money and still sucked, how much you need to compete for an at-large bid, who spent what and more:
Extra Points Website LINK
This covers the LSU title year

First, some notes on the methodology
Every D-1 and D-II school files an itemized athletic department budget report with the NCAA, called the MFRS report. This report breaks down how athletic departments generate and spend money, itemized by sport. It’s not a perfect data set, but it’s the closest thing we have in college sports to a unified data set.
We obtain these documents by filling hundreds of Open Records Requests. Because of those requests, and because of our data analysis, we’re able to compare spending across more than 170 schools.
The data you’ll see referenced here, and in all future newsletters in this series, comes from the Total Operational Expenses line item from that report. That number includes all the money a school spends on coaching salaries, administrative salaries, scholarships, travel, software, recruiting, and all sorts of other operational expenses. It does not include athlete revenue share payments. The numbers we are talking about here are not the “salary cap” for each team.
Matt Brown
@MattBrownEP
What I would love to understand better, and perhaps some of the quants in my readership can crunch better than I can, is what kind of relationship exists between particular kinds of spending and winning% (or RPI)
Probably need more data. Could be a good summer project.

His X LINK
@MattBrownEP
in today's Extra Points, we obtained the FY25 operating budget for (nearly) every public school college baseball program
here's who spent a lot of money and still sucked, how much you need to compete for an at-large bid, who spent what and more:
Extra Points Website LINK
This covers the LSU title year
First, some notes on the methodology
Every D-1 and D-II school files an itemized athletic department budget report with the NCAA, called the MFRS report. This report breaks down how athletic departments generate and spend money, itemized by sport. It’s not a perfect data set, but it’s the closest thing we have in college sports to a unified data set.
We obtain these documents by filling hundreds of Open Records Requests. Because of those requests, and because of our data analysis, we’re able to compare spending across more than 170 schools.
The data you’ll see referenced here, and in all future newsletters in this series, comes from the Total Operational Expenses line item from that report. That number includes all the money a school spends on coaching salaries, administrative salaries, scholarships, travel, software, recruiting, and all sorts of other operational expenses. It does not include athlete revenue share payments. The numbers we are talking about here are not the “salary cap” for each team.
Matt Brown
@MattBrownEP
What I would love to understand better, and perhaps some of the quants in my readership can crunch better than I can, is what kind of relationship exists between particular kinds of spending and winning% (or RPI)
Probably need more data. Could be a good summer project.
His X LINK
 3
3


Posted on 3/12/26 at 10:01 am to OU Guy
What a waste of fricking money by us

Posted on 3/12/26 at 10:12 am to OU Guy
We aren't even top 25? Damn we are fricking cheap. 
Posted on 3/12/26 at 10:12 am to CarolinaGamecock99
Tenn seems like the big loser. This does not include NIL either
Posted on 3/12/26 at 10:15 am to bigDgator
Your data is missing. A clip from article:
And finally, we can only obtain data from schools that respond to open records requests. Private schools, like Stanford, Duke, Yale, etc do not have to respond to FOIAs, and thus do not publish their MFRS reports. A few public schools, like Pitt, Temple, UCF, Delaware and Delaware State, are exempt from state open records laws. A handful of other schools have not yet responded to our repeated requests, either because they limit FOIAs to in-state residents (so we have to pay a stand-in), or because they’re simply very slow at responding to requests.
We are currently missing data from Air Force, Alabama State, Alabama A&M, Alcorn State, Army, Coppin State, ETSU, Georgia Tech, Florida, FIU, Jackson State, Morehead State, Morgan State, North Alabama, Texas Southern, Troy, South Alabama, South Carolina Upstate, UNC-Asheville, UNC-Greensboro, UC-Santa Barbara, UL-Monroe, UMBC, UT-Chattanooga, Tennessee State, and UT-Martin. If you happen to have the FY25 MFRS report for any of these schools, I’ll happily give you free premium Extra Points in exchange (and/or give you any of ours).
Posted on 3/12/26 at 11:11 am to OU Guy
PEAR rankings by Conf
PEARatings
@PEARatings
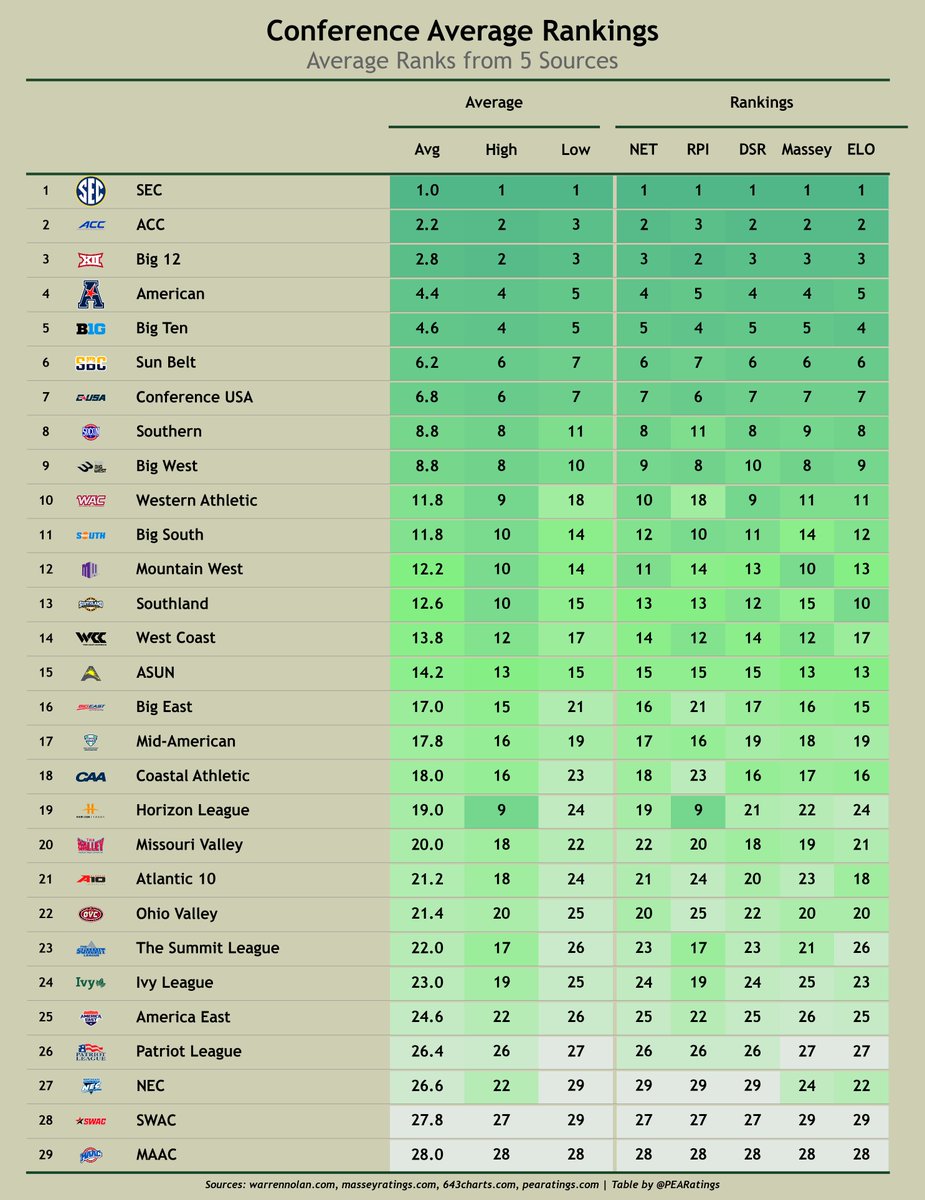
Conference Average Rankings
Taking the average rank value of these metrics, this where those average values rank. Right now, the American ranks as the fourth best conference.
RPI, ELO from Warren Nolan. Massey from MasseyRatings. DSR from 643Charts.
Basically, the playoffs start Fri when SEC conf play start. Its a 30 game playoff for seeding.
PEARatings
@PEARatings
Conference Average Rankings
Taking the average rank value of these metrics, this where those average values rank. Right now, the American ranks as the fourth best conference.
RPI, ELO from Warren Nolan. Massey from MasseyRatings. DSR from 643Charts.
Basically, the playoffs start Fri when SEC conf play start. Its a 30 game playoff for seeding.
Posted on 3/12/26 at 11:17 am to OU Guy
And yet we are still stuck with Mike Bianco.
Posted on 3/12/26 at 12:27 pm to FUBAREB
quote:
And yet we are still stuck with Mike Bianco.
Kinda like our basketball team stuck with Moser
Posted on 3/12/26 at 12:36 pm to CarolinaGamecock99
quote:Wish I could show my shocked face when y'all hired Paul Manieri. Did Tanner hire him or the new guy?
What a waste of fricking money by us
Posted on 3/12/26 at 12:59 pm to Diamondawg
PEARatings
@PEARatings
Out-of-Conference Win Percentages in Games Between Teams from the Top 10 Ranked Conferences (+ Oregon State)

@PEARatings
Out-of-Conference Win Percentages in Games Between Teams from the Top 10 Ranked Conferences (+ Oregon State)

 Page 1 of 1


Popular
Back to top